Problem set 3
Due by 11:59 PM on Monday, November 18, 2019
Deliverables:
Upload a zip file with your shiny app (as mentioned below) onto Canvas Problem Set 3 page.
In the Canvas comments, provide the url for your deployed shiny app on shinyapps.io. Mention in the comments if you worked with another student.
Task 0: Getting started
Create a new RStudio project somewhere on your computer. Open that new folder in Windows File Explorer or macOS Finder (however you navigate around the files on your computer), and create a subfolder there named data.
Download this R Shiny app template file and place it in your newly-created projectYou’ll probably have to right click on the link and choose “Save link as…”.
.
You will also need to download three compressed files. You can download the files as a zip file here. You will need to export them into a subfolder in your project called ‘data’.
In the end, the structure of your new project directory should look something like this:
your-project-name/
  app.R
  your-project-name.Rproj
  data/
    merchant.txt
    romeo.txt
    summer.txt
Objective: Analyzing word counts in Shakepeare’s plays.
For this problem set, you’ll create a Shiny app to explore three of William Shakespeare’s plays through simple data visualizations.
To create analyze the text, we’ll use the tidytext package, which is an accompanying package to Julie Silge and David Robinson’s “Tidy Text Mining” Book.
For context, you should read Chapter 3 in Tidy Text Mining to understand the basics of this package.
I provide the template Shiny app.R file and you need to fill in the rest of the app. There is not a lot to create and you can compete this assignment with just about 100 lines of R code in your app.R file!
Be sure to read the instructions carefully! If you skip a step, your app may still run, but you may miss some functionality and you will be deducted a point for each item you omit. See the bottom for an overview on grading.
Task 0: Libraries
To run this problem set, you’ll need six CRAN libraries installed on your RStudio session.
You will need: shiny, tidyverse, wordcloud, ggplot2, shinythemes, and RColorBrewer.
You can manually install them individually (if you don’t have them).Or maybe google how to install multiple CRAN libraries at once to save the time of manually typing in each of these…
Task 1: Create the ui’s layout
First, open your app.R file and add a sidebarLayout with a sidebarPanel on the left and the mainPanel on the right.Be sure to add a comma after the titlePanel function!
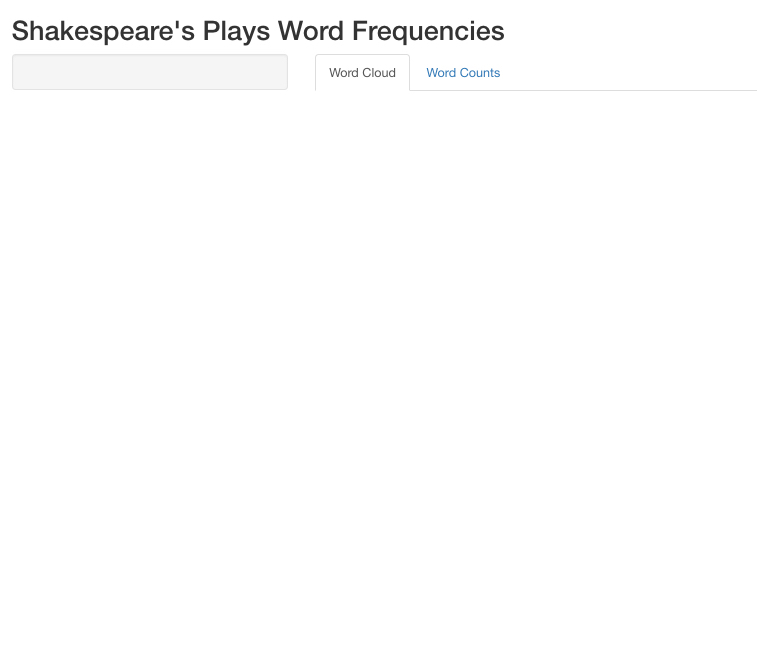
Next, create two tabs using the tabsetPanel nested within the mainPanel. The first tab is named “Word Cloud” and the second is named “Word Counts”. You can leave the second argument blank for now (we’ll fill this in in the next task.)If you have forgotten how to do layouts or tabsets in Shiny, read this page
.
What your app should look like:
Task 2: Add in the ui’s inputs
Next, you will need to add in six input functions to serve as drop-down selections for the user. These will be pre-processing steps.Use the input section of the shiny cheatsheet to refresh your memory of the different input function types.
Make sure between each new input you put in a comma or else you’ll get error messages!
- Create a select input with a unique id name, label (i.e., what the user will see), and have it’s choices parameter equal
books.bookswill be a list of names of Shakespeare’s three plays.
To set what books is, copy and paste this line of code and put it at the top of your app.R file, i.e., below where you call libraries and above (and outside of) the ui function.
# The list of valid books
books <- list("A Mid Summer Night's Dream" = "summer",
               "The Merchant of Venice" = "merchant",
"Romeo and Juliet" = "romeo")- Create a checkbox input for stop words. Give it an unique id (e.g., “stopwords”), an appropriate label, and set its value as TRUE (i.e.,
value = TRUEas your last parameter). This means that the initial value of this input will be TRUE, i.e., remove stop words from your counts.
3 Create an action button to run the app. Give it a unique name and an appropriate label.
Add in a horizontal line
hr()which will denote a different section in your input space.Add in the header
h3("Word Cloud Settings")which will denote the next 3 inputs are related to the Word Cloud tab.Create a slider input for setting the maximum number of words in the word cloud. Give it an unique id (e.g., “maxwords”), an appropriate label (“Max # of Words”), and set its last three parameters as
min = 10, max = 200, value = 100, step = 10. This sets its initial value as 100 but its minimum and maximum values as 10 and 200 (respectively).Create a slider input for the size of the largest words. Give it a unique id, an appropriate label, and set its parameters as
min = 1, max = 8, value = 4.Create a slider input for the size of the smallest words. Give it a unique id, an appropriate label, and set its parameters as
min = 0.1, max = 4, value = 0.5.Add in another horizontal line (
hr()) this time to denote the Word Counts chart parameters and a header 3 with the title “Word Count Settings” (similar to Step 4)Create a slider input for the minimum word counts for words to show up in the Word Counts chart. Give it a unique id, an appropriate label, and set its parameters as
min = 10, max = 100, value = 25.Create a slider input for the font size of the words. Give it a unique id, an appropriate label, and set its parameters as
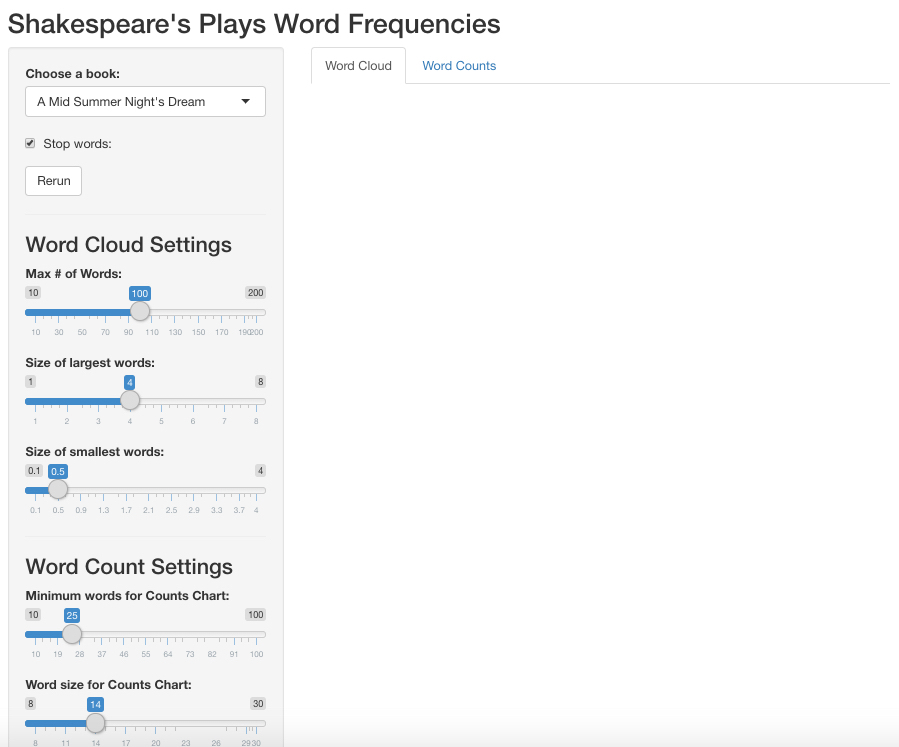
min = 8, max = 30, value = 14.
Your shiny app should now look like this:
Task 3: Add in your UI outputs
For this step, we’ll add in our UI outputs for the two plots we’ll have in our app.
Each plot will be on a different tab within our mainPanel section.
Add in a plotOutput in your “Word Clouds” tab. Name its object “cloud.”Remember, we have to make sure later on that when we create our wordcloud in the server section to name it as “cloud” so this step will plot the wordcloud in its appropriate tab.
Add in a plotOutput in your “Counts” tab. Name its object “freq”.
Your shiny app will look the same as at the end of Task 3.
Task 4: Add in your text pre-processing step
Next, let’s add in our text pre-processing step using tidytext. For this part, we’re going to wrap this step as an R function that takes multiple arguments.
This will be what runs when the user clicks the action button with the arguments being filled in based on what the user selects.
Make sure to put it at the top of the code (before UI function but after calling the libraries). Also make sure to add library(tidytext) as it depends on functions in the tidytext package.
getFreq <- function(book, stopwords = TRUE) {
  # check that only one of three books is selected
  if (!(book %in% books))
    stop("Unknown book")

  text <-  tibble(text = readLines(sprintf("./data/%s.txt", book), encoding="UTF-8"))

  # could also pass column of text/character instead
  text <- text %>%
    unnest_tokens(word, text) %>%
    count(word, sort = TRUE)

  if(stopwords){
    text <- text %>%
      anti_join(stop_words)
  }

  return(text)
}
Test this function out, i.e., run it once in your console and then see if you can provide correct inputs to get it to run. Make sure you have the correct lookup for your data folder (i.e., txt files!). If you set up your project correctly, this shouldn’t be a problem. But if not, you’ll have lookup errors.
This step only provides initial pre-processing steps (as a function) so it will not change what your Shiny app’s ui looks like.
Task 4: Add in reactivity to update word counts based on inputs
Next, we’ll add in reactivity so that the getFreq function is run whenever the action button in the sidebarPanel is clicked.
To start, please read this tutorial on reactivity. This will make sure you understand reactivity before proceeding.
For this task, add in a reactive function in your server side that includes both ({}) as its inputs and assigns its output as freq.
For the eventReactive function, we want this function to activate when the actionButton in the UI is clicked. Since the button is an input, put the first argument of this function as input$[id of action button], where [] is whatever id you gave the actionButton in the UI. Make sure that this is after the first “(” but before the eventReactive’s first “{.”I can almost guarantee many of you may have issues because you didn’t read this. If you do, then look at the App 1 example for ?eventReactive
Last, within the reactive function add in this function and replace the “…” with the names of your input selection and stopwords from Task 2.
withProgress({
  setProgress(message = "Processing corpus...")
  getFreq(...) # ... = replace with the two inputs from Task 2
})
This step again will not change the UI.
Task 5: Add in render functions to complete server-side
For our last two steps, we’ll need to set what is in each of the two output plots.
For the wordcloud, we’ll use the wordcloud function from the wordcloud package.
First, we’ll the appropriate render function that aligns with how we specified the wordcloud would appear in the UI (hint: what is the output type in the UI that uses the “cloud” input?). Use that render function and assign it (i.e., <-) to the output object named cloud.Do you remember how to assign output objects after rendering? Hint: it’ll look like ______$cloud. You fill in the blank.
Within the function’s {} brackets, now call the reactive function object. Since this is a reactive object, it’s usually best to assign it to a new object (e.g., v) but make sure to keep the objects () since its a reactive object.For more details, look at this tutorial on Reactivity, especially the middle section where they discuss calling reactive objects.
Within your render function (i.e., still inside {} brackets), add in:
v <- freq()
pal <- brewer.pal(8,"Dark2")

v %>%
  with(
    wordcloud(
      word,
      n,
      scale = c(XXX, XXX),
      random.order = FALSE,
      max.words = XXX,
      colors=pal))
Second, you need to determine what are the correct inputs to put into the three “XXX” blanks.
Since this uses brewer.pal() function, be sure to add in library(RColorBrewer) to your library calls at the top of your code.
This assumes that you assigned the reactive freq as v. All other parameters are values for the wordcloud (e.g., max_size of the words in the word cloud). See ?wordcloud for more details about what the parameters mean.
Next, you’ll need to create a second render function that assigns the object of the freq output object. Like the previous render function, we’ll use the reactive counts that you’ll need to assign (e.g., can assign v again since a different function).
Last, build a ggplot horizontal bar chart that will be the object shown in the “Word Counts” tab. Before running your ggplot, create a dplyr pipeline that:
Filters for words with a larger count (n) than the input from Task 2-10.
Within your aesthetics function, wrap word with the
reorder()function so that the bars are ordered. Be sure to select the correct second input (when in doubt, look for?reorderto know what are its inputs).Modify the font size for all of the text of plot based on the input from Task 2-11. (If in doubt, query google “modify font size for ggplot”. Hint: You’ll need to use the
theme()function and within it use theelement_textfunction)Remove all x, y labels from your chart.
At this point, your app should look like this:
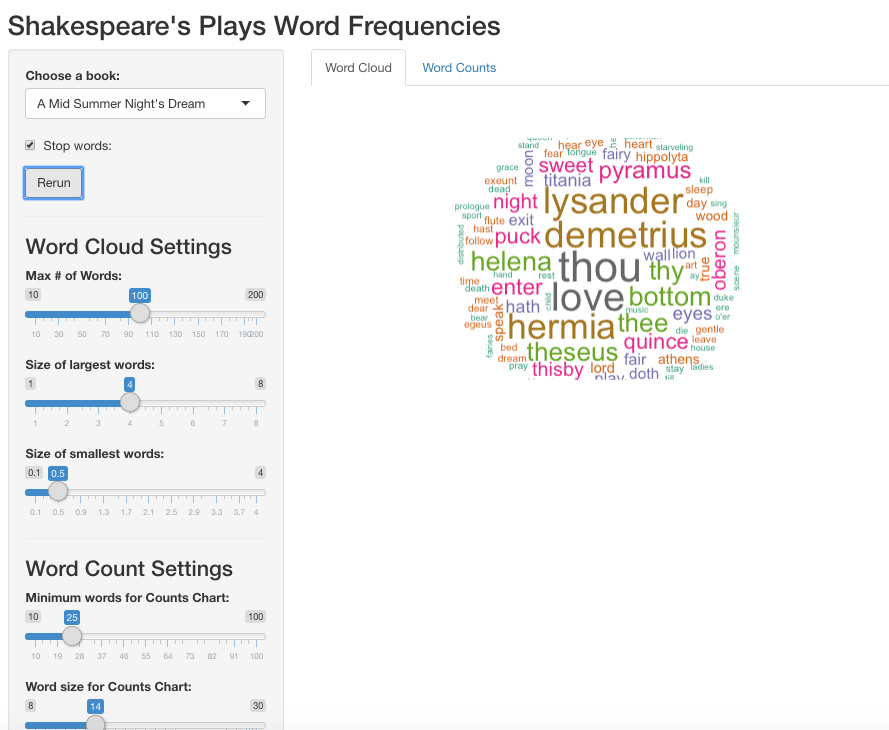
Task 6: Add in shinythemes and modify height
Last, we want to make additional changes that improve the look of our app and its performance.
Shinythemes. Add in the
library(shinythemes)to your library call and then add intheme = shinytheme("cerulean")as your first argument to yourfluidPage()function in your UI. Choose a differentshinythemesthan “cerulean” using this website (e.g., “cosmo”, “united”, etc.).Modify the height of the word clouds and counts plot. If you look at the “Counts” tab, your plot is likely “squished” vertically. Let’s increase the height of this plot by add in the parameter
height = "600px"in theplotOutputfunction. Do the same for the word cloud. This is how you manually modify the size of your outputs. The same applies towidth. View?plotOutputto see the other parameters you can pass to the function.
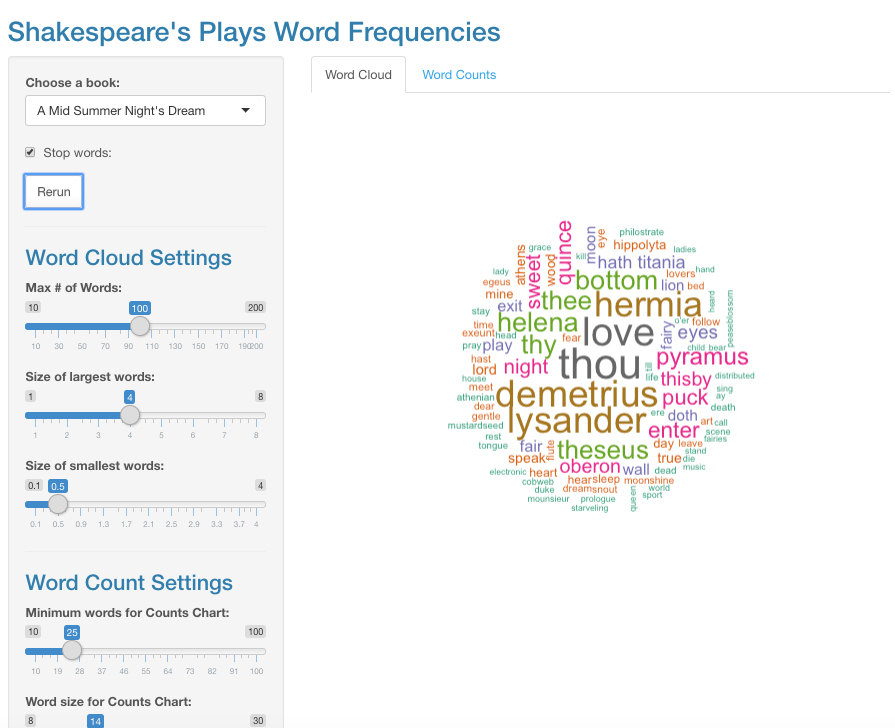
Depending on what shinythemes you selected (e.g., this is “cerulean”), your final app should look like this:
Task 7: Deploy to shinyapps.io
If you’ve gotten this far, all that’s left is submission.
You will need to submit your project’s folder (as a compressed zip file) and deploy your app on shinyapps.io.
Compress your folder as a .zip file and submit it to Canvas by 11:59pm on Monday, November 18, 2019.
Next, deploy your Shiny app to your shinyapps.io account. If you have not already set up your login to shinyapps.io, see this page for a recount of how to do this.
Grading
You will be graded on:
The correctness of your app (does it work? did you follow instructions?) (minus points will depend on severity of errors)
Deployed your app to shinyapps.io (-20% if you did not correctly do this)
As always, do not set your working directory (that’s what R projects are for).
Help! I got an error.
Three step process:
Describe your error message in words, perhaps adding in “shiny”.
Copy and paste this into your favorite search engine.
Read. Repeat by refining your keyword search.
If this doesn’t work, consider these questions:
Do you have unique names for your inputs and outputs and are they correctly assigned?
Did you call all the libraries mentioned in Task 0?
Did you make sure not to include a
install.packages()?Remember you only need to run these once. No code should have this uncommented.
Work backwards, i.e., can you complete task 1? task 2? task 5? If you can identify which task, this will lead you to figure out where your problem is. Similarly, remove one related function / block of code to determine when your app starts working again.
Consider using the
browser()function. Read this post on debugging in shiny.