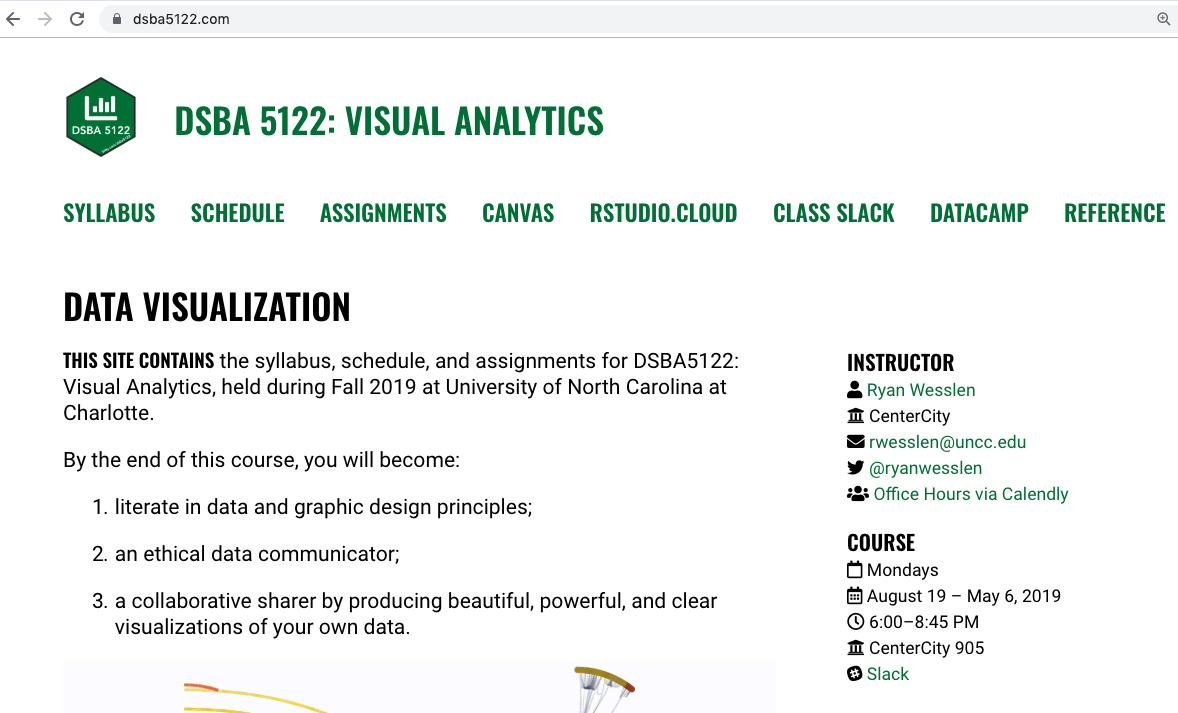
class: center, middle, inverse, title-slide # DSBA 5122: Visual Analytics ## Class 1: Intro to Visual Analytics ### Ryan Wesslen ### August 19, 2019 --- class: center, middle # Welcome  --- # About Me - Associate Faculty Member in UNCC's DSBA Program - PhD Candidate in Computing & Information Systems - Data Scientist in Bank of America's Chief Data Science Org (NLP Team) --- # Introduce yourself - Name - What's your academic and professional background? - Programming (e.g., R, python, JavaScript, SQL) & visualization experience (e.g., Excel, ggplot2, Tableau, Spotfire) - What are you interested to learn more about data visualizations? To do by next class: Send me an introduction email <rwesslen@uncc.edu> answering these questions. It's up to you on length. This is my chance to learn about your background. ---  <https://dsba5122.com>: Review the syllabus, schedule, and assignments. --- .pull-left[ ## Visualization Theory & Concepts - What makes a good visualization? - What are the best visualization tools for your problem? - What human factors are important to consider in designing visualizations? ] .pull-right[ ## Data Visualization in Practice - R: `tidyverse`: core data science for Exploratory Data Analysis (EDA) - R: `htmlwidgets`: instead of JavaScript, D3 - R: `shiny`: instead of HTML/CSS/Server-side ] --- # Grading: | Assignment | Percent | |:--------------------------:|:-------:| | Attendance & Participation | 10% | | 4 Datacamp courses | 10% | | 4 Problem sets | 20% | | 4 Online Quizzes | 20% | | Group: Design Contest | 10% | | Group: Final Project | 30% | --- # Grading | Grade | Range | |:------------------:|:------------:| | A (Comendable) | 90% – 100% | | B (Satisfactory) | 80% – 89.99% | | C (Marginal) | 70% – 79.99% | | U (Unsatisfactory) | < 70% | --- # Policies: * Quizzes **cannot** be turned in late. - DataCamp and Problem Sets get **50%** penalty 1 day. 0% credit longer. * Formal announcements sent thru email. - Informal announcements sent thru Slack. - Canvas will only be for assignment submission and tracking grades. --- # Policies * Collaboration is encouraged (except quizzes) - Projects in groups of 3 (you select). - Problem sets can work in pairs. - Cannot work together on quizzes. * RStudio.Cloud is available to run examples. - Students are encouraged (but not required) to learn to run locally. --- ## Course Communication For many students, a lot of the course material may be very new. Many students' first reaction when get first R error message or question on programming is to email me. --- ## When you have R/run questions: 1. Google it! 2. Ask a classmate. 3. Post your question on the course Slack channel. I'll likely answer it. 4. Email the TA, Tarun Sharma. Be clear and concise with your question. 5. Email me at last resort. -- > Avoid saying: "I'm not a programmer, computer scientist, [or whatever else], therefore..." Data Scientist Creed: If you don't know it, learn it. --- ## Course Material If you have course or personal questions (excuse absences, personal issues, etc.), that's when to email me. --- class: center, middle # Let's get started! <img src="https://media.giphy.com/media/1BVuXduUzNros/giphy.gif" width="600px" style="display: block; margin: auto;" />