Visual Representations II
Materials for class on Monday, September 9, 2019
Contents
Tweet of the Day
🌟 guide to visual encoding types from @tamaramunzner's "Visualization & Journalism" https://t.co/A2x96QYNoL #dataviz #infovis pic.twitter.com/2FIyXeWk4h
— Mara Averick (@dataandme) October 17, 2018
Tamara Munzner is one of the most influential data visualization researchers. Her textbook “Visualization Analysis and Design” is one of the most popular data viz books and some of her former students are now leaders in data viz (e.g., Matt Brehmer, Melanie Tory, Michael Seldmair, and Miriah Meyer).
,Mara Averick is RStudio’s tidyverse developer advocate, which essentially means she’s one of the most influential champions of all things tidyverse. She is an absolute must-follow on Twitter and noted “data sciolist” who excels at commmunicating the technical issues of tidyverse in a non-technical way, e.g., her 2018 RStudio::conf talk.
Announcements
Problem Set 1 is due Monday, Sept 16th. You will need to submit your zip file (of your RStudio Project) on Canvas by 11:59pm next Monday, Sept 16. You can work in pairs but each person has to submit. 50% penalty 24 hours late, 0% credit 24+ hours late.Read Healy’s Chapter 1 if you’re having problems learning RMarkdown/basics of R or his Appendix chapter if you’re having problems with RStudio projects.
Quiz 1 will be available 11:59pm, Monday Sept 9th. It is an online (Canvas), take home quiz. Please carefully read the instructions. It must be completed before class on Monday, Sept 16 (5:59pm). There are no makeups or quizzes that can be turned in late (if you don’t complete it in time, you get 0% credit).One way to prepare for the quiz is use DataCamp’s Practice mode for DataCamp 1: Intro to tidyverse. You can either connect via a browser or download DataCamp’s mobile app.
DataCamp 2 is due by 11:59pm Tuesday, Sept 24th. Same policies as DataCamp 1.
Reminder that there are a few optional DataCamp courses. These are to help students who are brand new to R and data importing, cleaning, and manipulation. They will not be graded.
Slides
- Michael Friendly’s Psych 6135: Psychology of Data Visualization Language of Graphics: Bertin to GoG to
ggplot2These slides were modified for this class.
- Garrick Aden Buie’s A Gentle Guide to the Grammar of Graphics with ggplot2
Lab 3: Make a plot (ggplot2)
Go to our healy-dataviz project and open “03_make_a_plot.Rmd”.
This covers Chapter 3: Make a Plot in Healy.
Helpful Links
Jenny Bryan’s ggplot2 tutorial GitHub / slides
Allison Hill’s Data Visualization in the Tidyverse The Great Tidy Plot Off
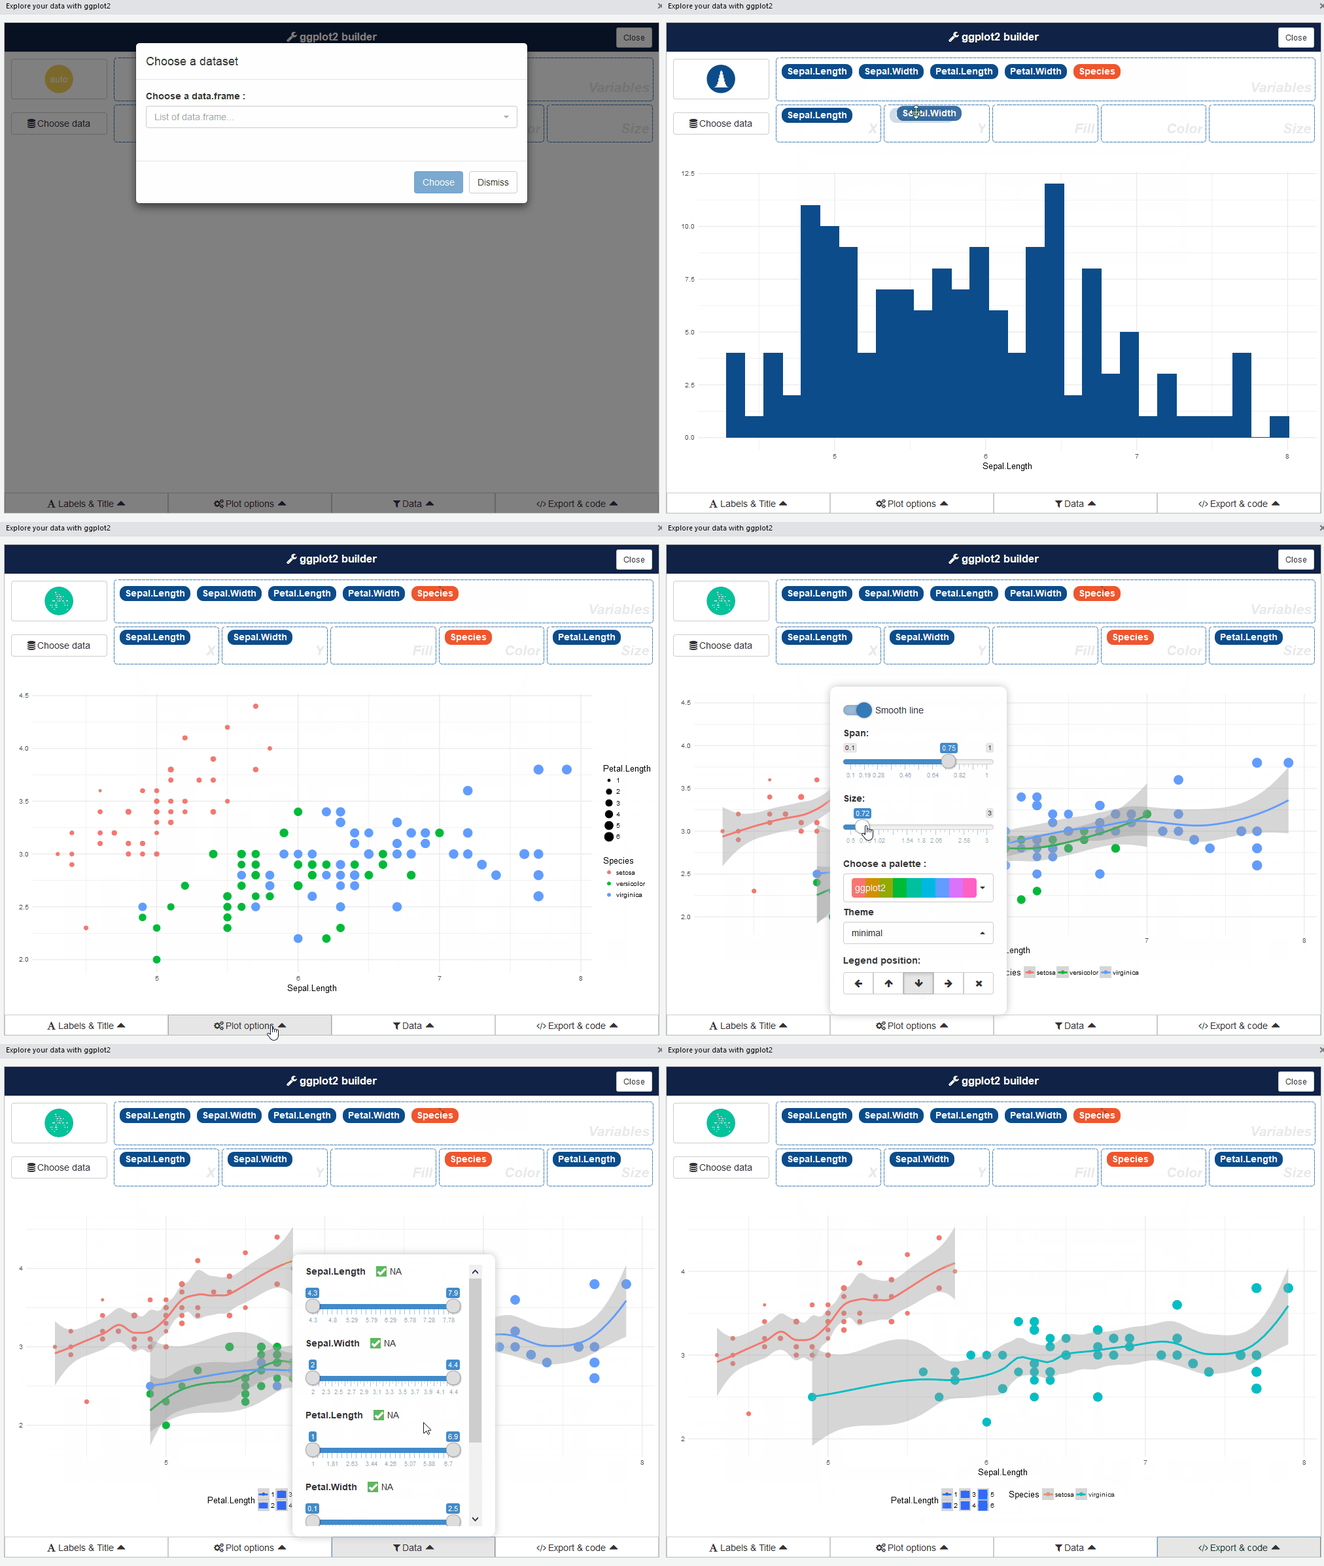
esquisseesquisse is a helpful way to learn ggplot2. You can install it like a normal R CRAN package. I highly recommend it if you need help.
